
Operations Data
Mortality Rate
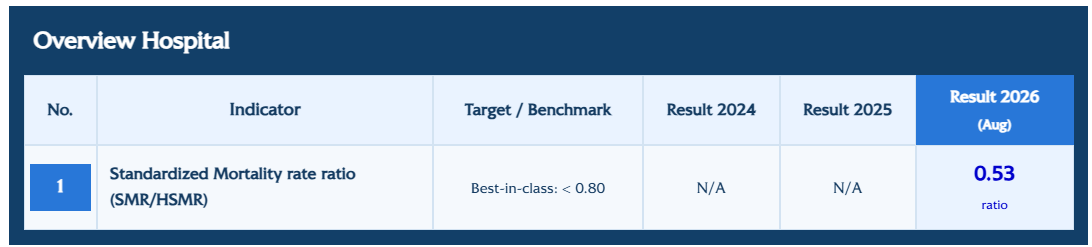
Overview Hospital
| No. | Indicator | Target / Benchmark | Result 2024 | Result 2025 | Result 2026 (Aug) |
1 | Standardized Mortality rate ratio (SMR/HSMR) | Best-in-class: < 0.80 | N/A | N/A | 0.53 ratio |
Healthcare Associated Infection (HAIs)
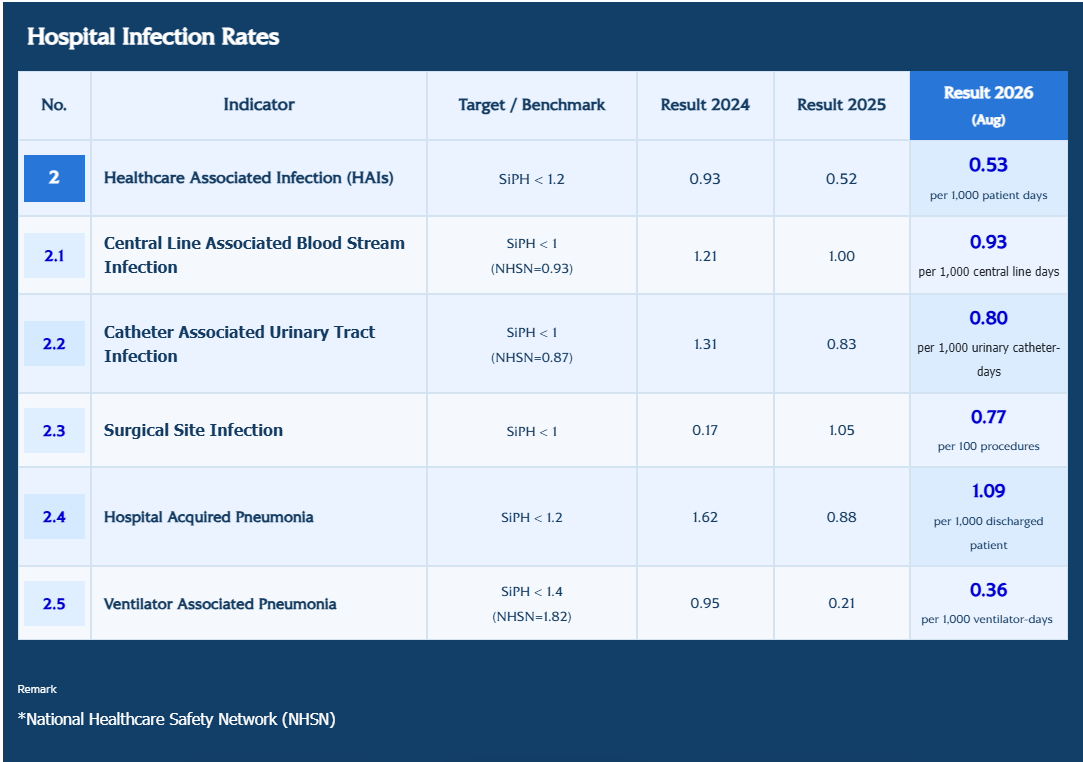
Hospital Infection Rates
| No. | Indicator | Target / Benchmark | Result 2024 | Result 2025 | Result 2026 (Aug) |
2 | Healthcare Associated Infection (HAIs) | SiPH < 1.2 | 0.93 | 0.52 | 0.53 per 1,000 patient days |
2.1 | Central Line Associated Blood Stream Infection | SiPH < 1 (NHSN=0.93) | 1.21 | 1.00 | 0.93 per 1,000 central line days |
2.2 | Catheter Associated Urinary Tract Infection | SiPH < 1 (NHSN=0.87) | 1.31 | 0.83 | 0.80 per 1,000 urinary catheter-days |
2.3 | Surgical Site Infection | SiPH < 1 | 0.17 | 1.05 | 0.77 per 100 procedures |
2.4 | Hospital Acquired Pneumonia | SiPH < 1.2 | 1.62 | 0.88 | 1.09 per 1,000 discharged patient |
2.5 | Ventilator Associated Pneumonia | SiPH < 1.4 (NHSN=1.82) | 0.95 | 0.21 | 0.36 per 1,000 ventilator-days |
Remark
*National Healthcare Safety Network (NHSN)
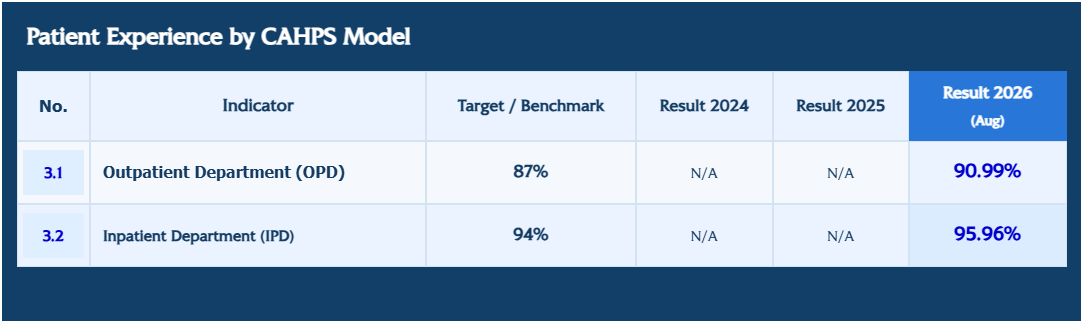
Patient Experience
Patient Experience by CAHPS Model
| No. | Indicator | Target / Benchmark | Result 2024 | Result 2025 | Result 2026 (Aug) |
3.1 | Outpatient Department (OPD) | 87% | N/A | N/A | 90.99% |
3.2 | Inpatient Department (IPD) | 94% | N/A | N/A | 95.96% |
Clinical KPIs
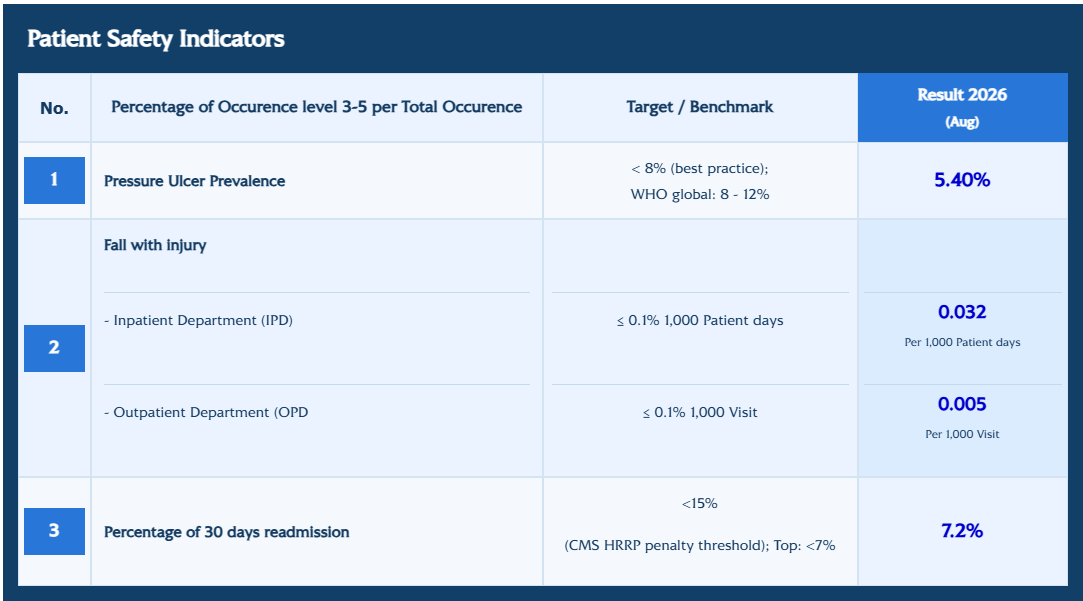
Patient Safety Indicators
| No. | Percentage of Occurence level 3-5 per Total Occurence | Target / Benchmark | Result 2026 (Aug) |
1 | Pressure Ulcer Prevalence | < 8% (best practice); WHO global: 8 - 12% | 5.40% |
2 | Fall with injury - Inpatient Department (IPD)
- Outpatient Department (OPD | ≤ 0.1% 1,000 Patient days
≤ 0.1% 1,000 Visit | 0.032 Per 1,000 Patient days
0.005 Per 1,000 Visit
|
3 | Percentage of 30 days readmission | <15% (CMS HRRP penalty threshold); Top: <7% | 7.2% |
Mortality Rate
Healthcare Associated Infection (HAIs)
Patient Safety